Notebooks are a web-based Jupyter IDE with shared persistent storage for long-term development and inter-notebook collaboration, backed by accelerated compute.
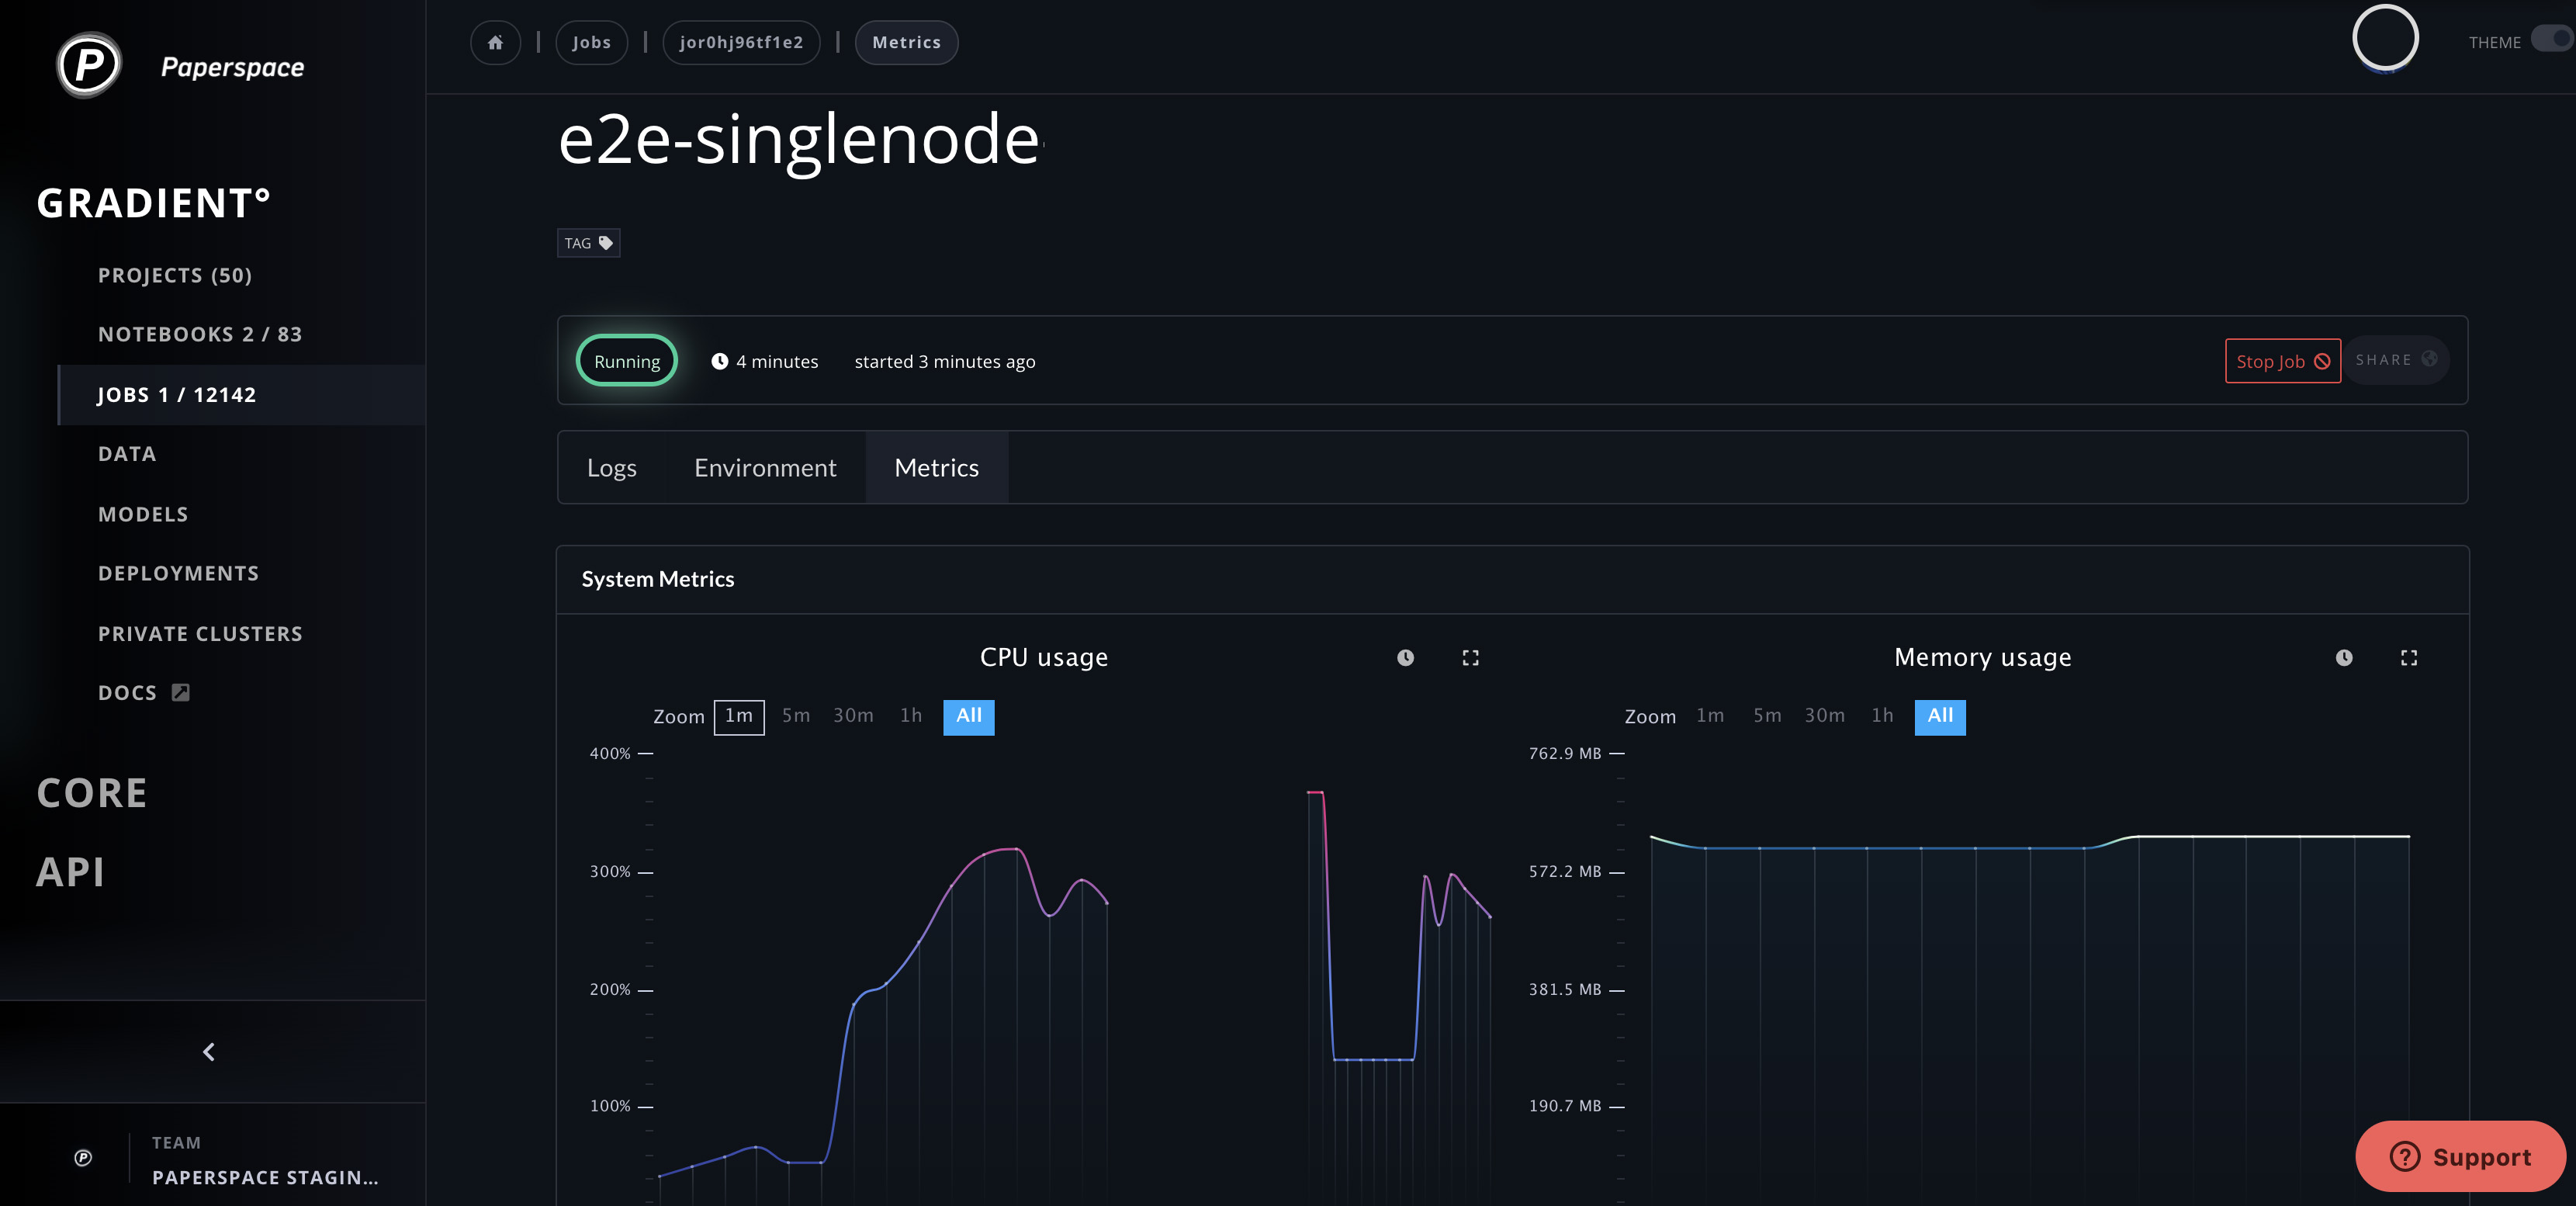
Gradient workloads can record metrics that are available both in real time or after the workload is complete. Gradient displays these metrics in the web UI and are queried or streamed in the CLI.
Gradient can log three different kinds of metrics which are hardware metrics, framework metrics, and custom user metrics.
All Gradient workloads like Experiments and Deployments monitor and track CPU, memory, and networks. If the machine is equipped with a GPU, this is also tracked.
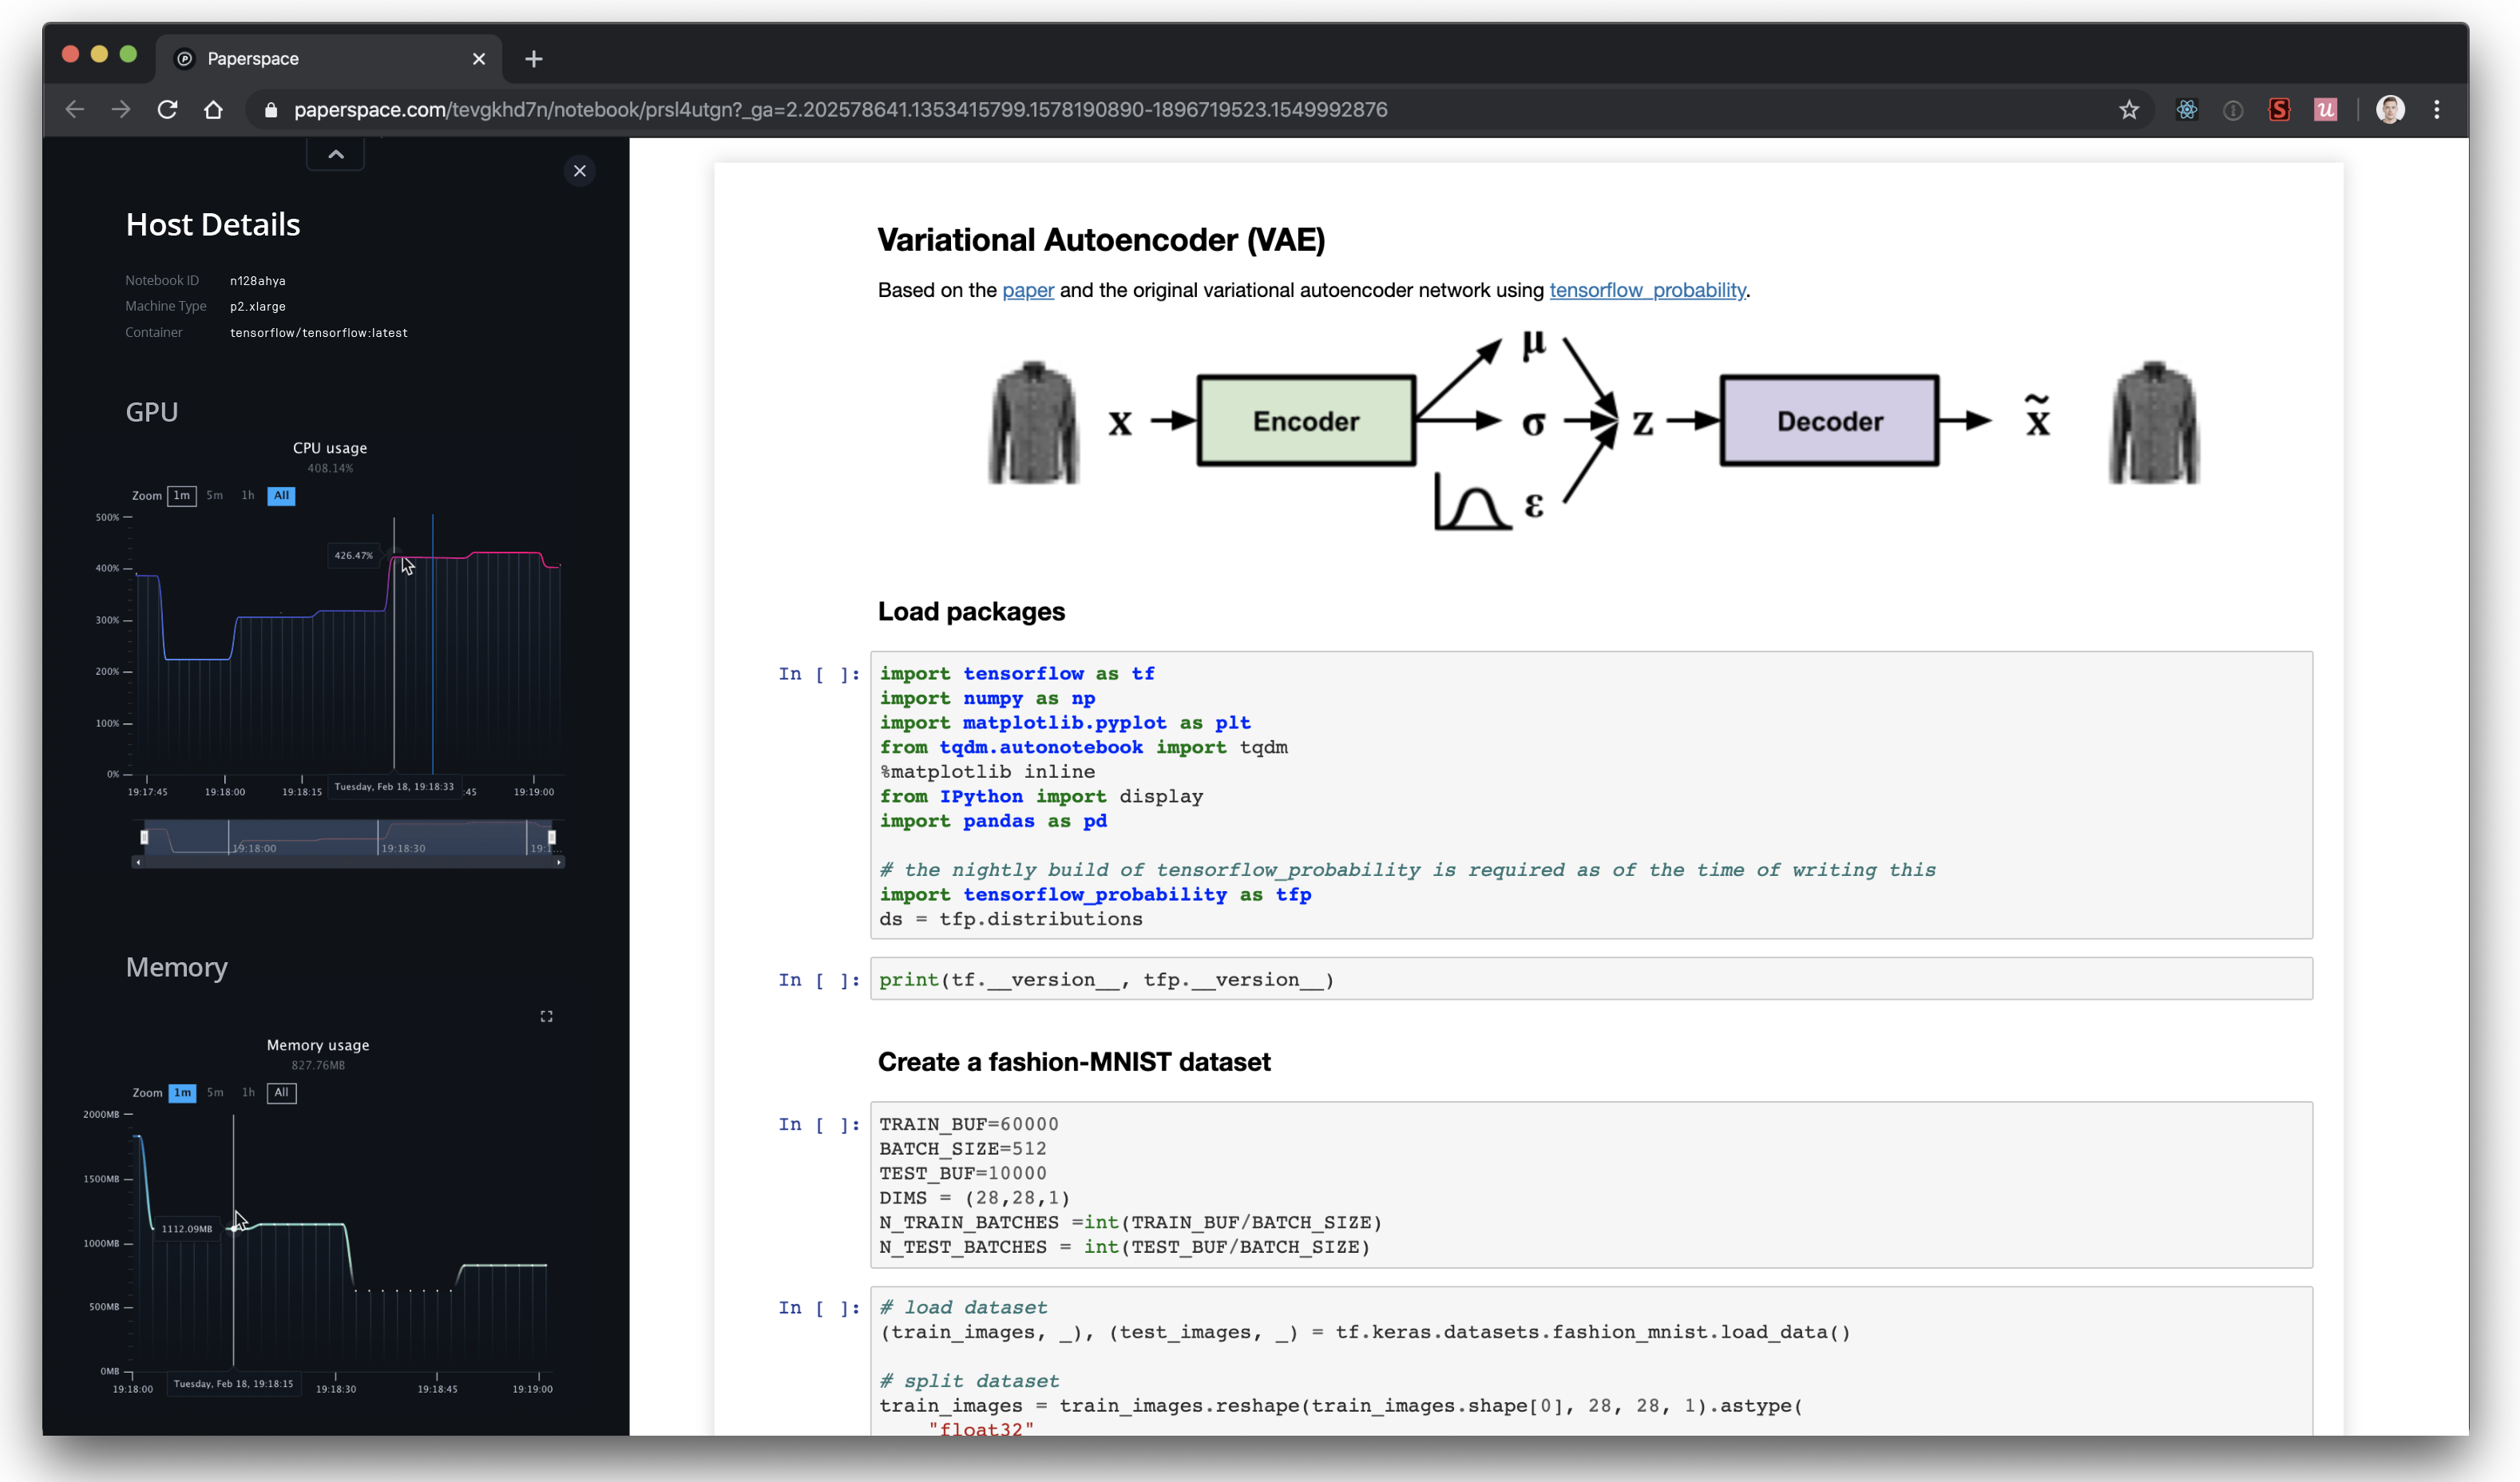
To view notebook metrics, you can see a minimal version in the notebook header and open a more detailed version if needed.
If you want to query the metrics for a given workload using the CLI, you could use the syntax below which uses Experiments. Deployments and Notebooks syntax is the same as the Experiments example below.
Usage: gradient experiments metrics [OPTIONS] COMMAND [ARGS]...

  Read experiment metrics

Options:
  --help  Show this message and exit.

Commands:
  get     Get experiment metrics
  stream  Watch live experiment metrics